1
272
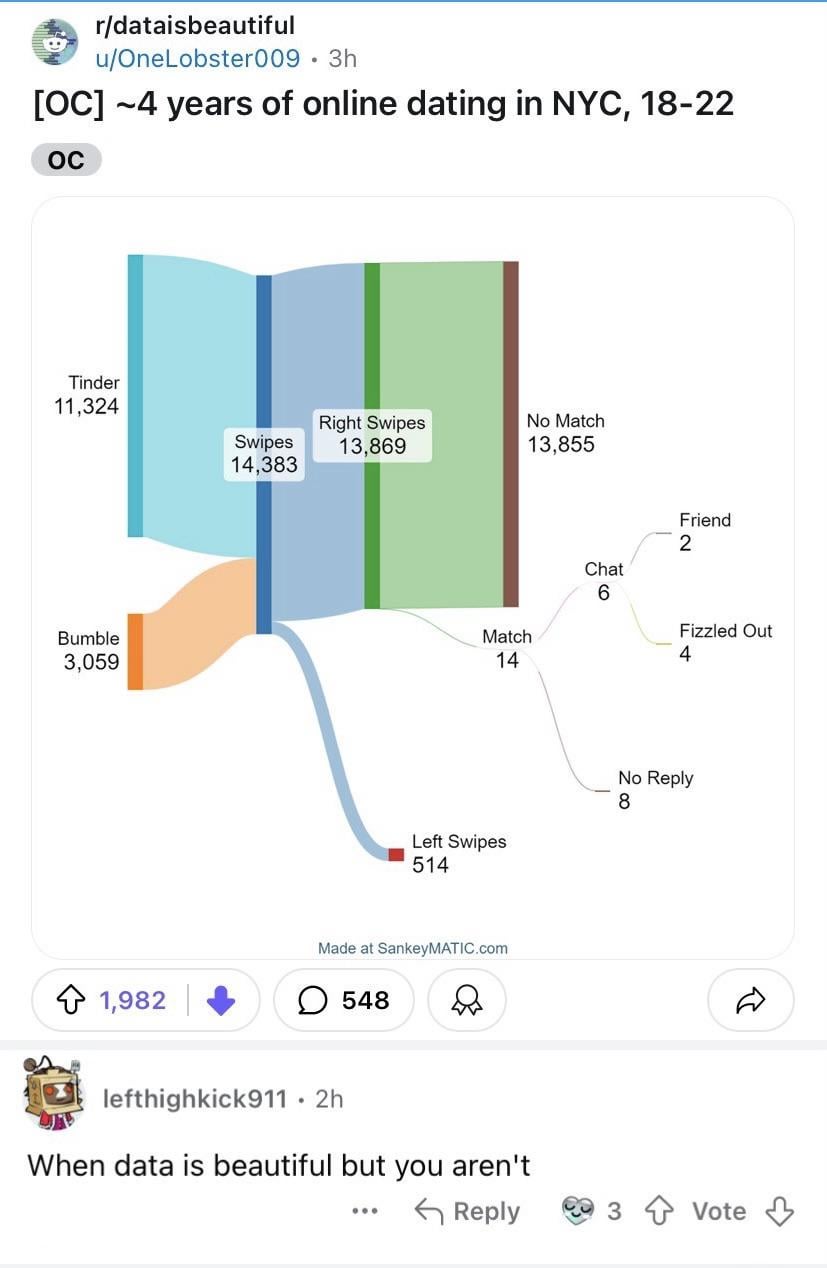
More dataisdepressing than dataisbeautiful

More dataisdepressing than dataisbeautiful
cross-posted from: https://feddit.org/post/2312726
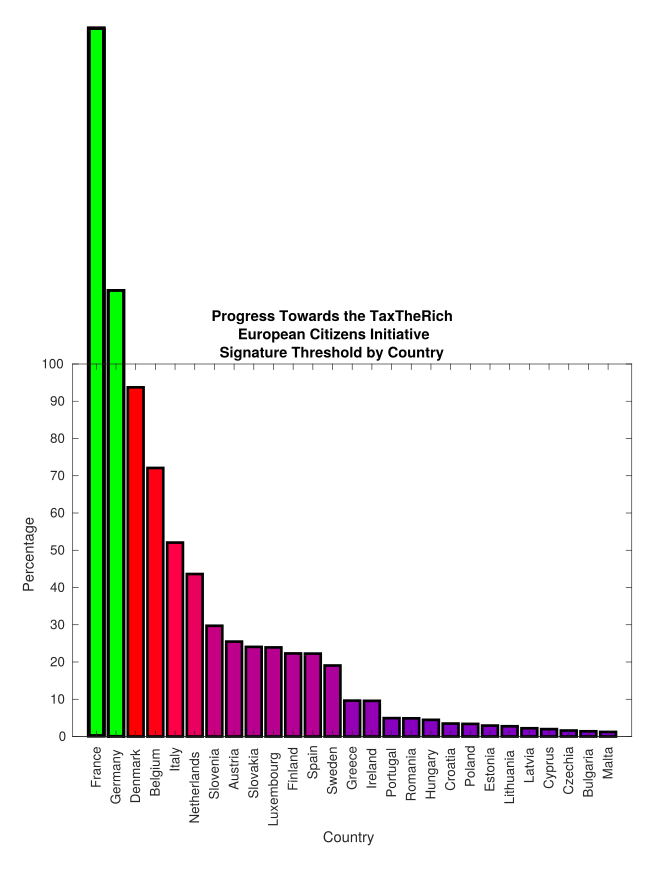
Tax The Rich EU-Petition Update
We need taxes for all - also the super-rich.
"Tax the rich" is an official EU petition. The EU Parliament has to deal with it when successful.
7 EU countries must reach the quorum Check yours in the chart and share!
The petition calls for the introduction of a wealth tax on very large fortunes. Sign now
cross-posted from: https://programming.dev/post/18098231
Have you ever wondered if your keyboard shortcuts are set up optimally? Well, I did, so I decided to visualize it with a heat-map.
It proved to me that I rely on my left pinky too much, so I'll try to rework my shortcuts.
You can check out the project here, currently it only works on Linux.

Purged voter count data by ZIP (Postal) code from the Ohio Secretary of State's website (https://registrationreadiness.ohiosos.gov/#). Voting age population data is from the 2022 American Community Survey published by the US Census.

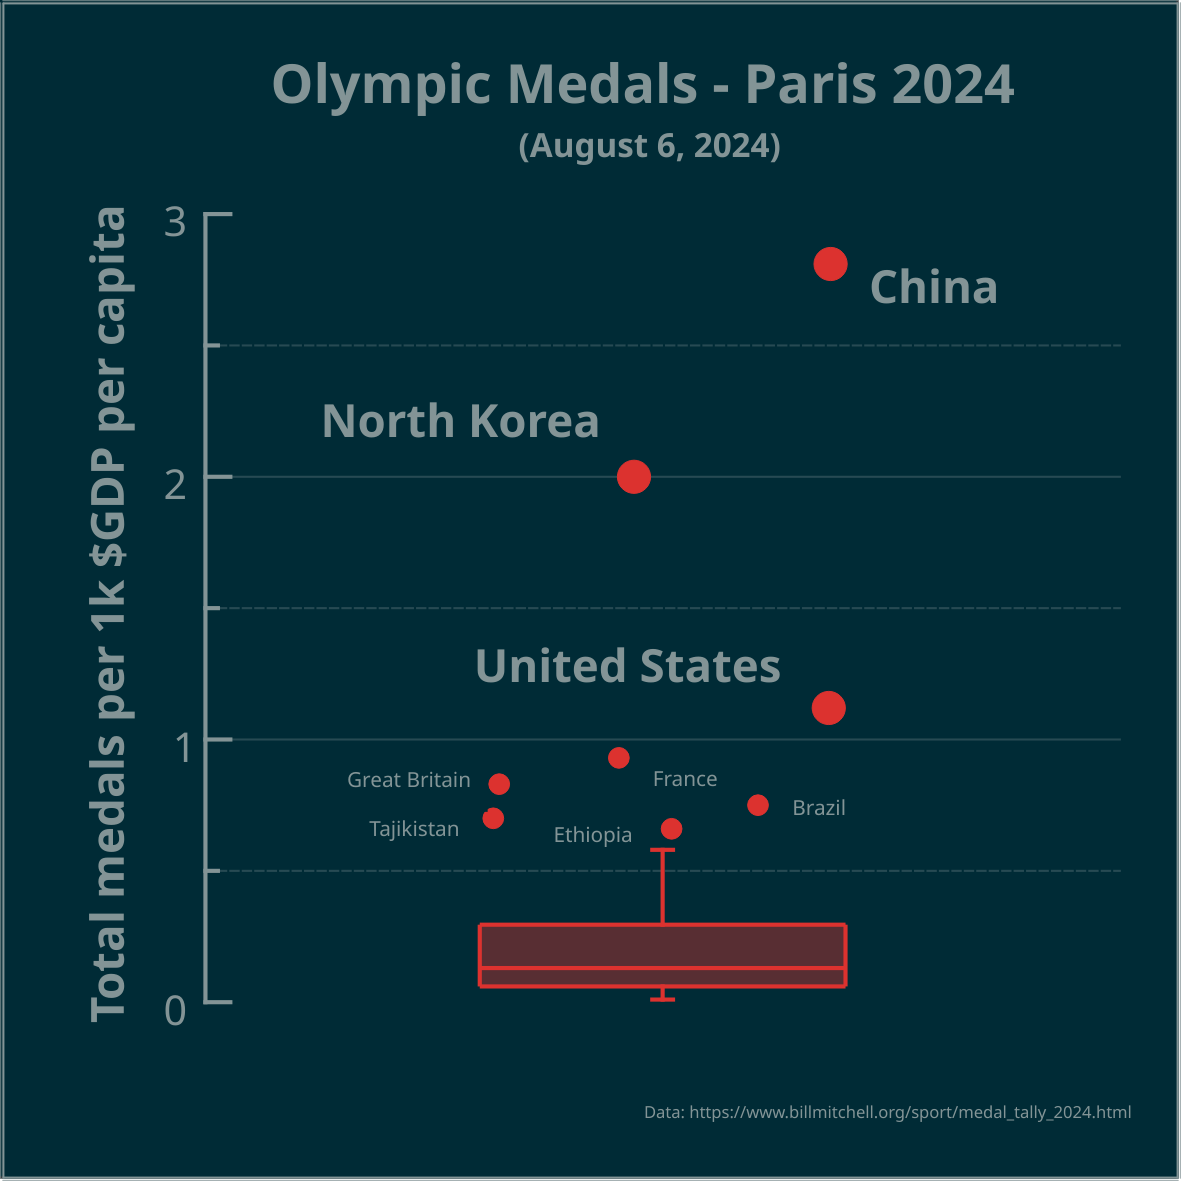
▶️ Total olympic medals per 1k $GDP per capita - Paris 2024 - represented in the Tukey's boxplot 🏅
The highest number, relative to $GDP per capita, is best. Outliers marked as circles. Made in #LabPlot, an open-source data analysis and visualization software.
#Olympics #Olympics2024 #France #China #NorthKorea #USA #UnitedStates #UnitedKingdom #UK #Brazil #Australia #Japan #Italy #Canada #Germany #Netherlands #Spain #DataAnalysis #DataViz #OpenSource #Sport
A place to share and discuss data visualizations. #dataviz
(under new moderation as of 2024-01, please let me know if there are any changes you want to see!)


